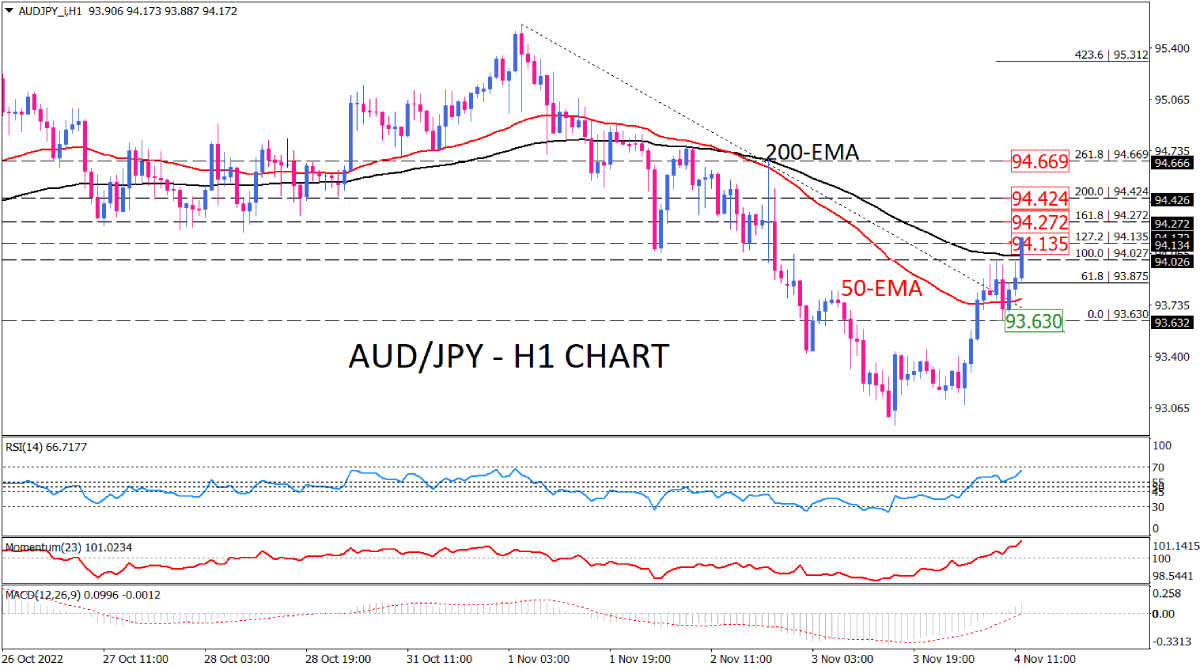
AUD/JPY buyers seek a short-term reversal
As AUD/JPY buyers violated the descending trendline to new highs on the one-hour chart, positive momentum is picking up in the market, with bulls tackling the 200-EMA, located in a resistance zone between the 94.027 and 94.135 boundaries.
If intensifying bullish bias persists, the pair can bounce off this crucial zone to the upside, aiming for the 94.272, which mirrors the 161.8% Fibonacci projection of the last downswing from 94.027 to 93.630. A sustained break above this barrier will open more headroom towards the 94.424 key level. Further traction can result in overstepping this obstacle, which will turn buyers’ attention to 94.669.
Otherwise, should the 200-EMA holds, the price is expected to remain sideways between 94.135 and 93.630 for some time. In the event that sellers retake control of the market a fall below the 93.630 support level will trigger a sell signal.
Short-term momentum oscillators suggest that buying pressure is accelerating. RSI is rising firmly in positive territory, heading towards the 70-level. Momentum is pointing north near its previous peak in buying region. MACD histogram is signalling bullish turn as MACD bars have crossed zero to the upside and signal line is on the verge of a crossover as well.

Technical Analysis
Discover ideal profit opportunities for your everyday trading with the help of our in-depth technical insights comprised of facts, charts and trends.


