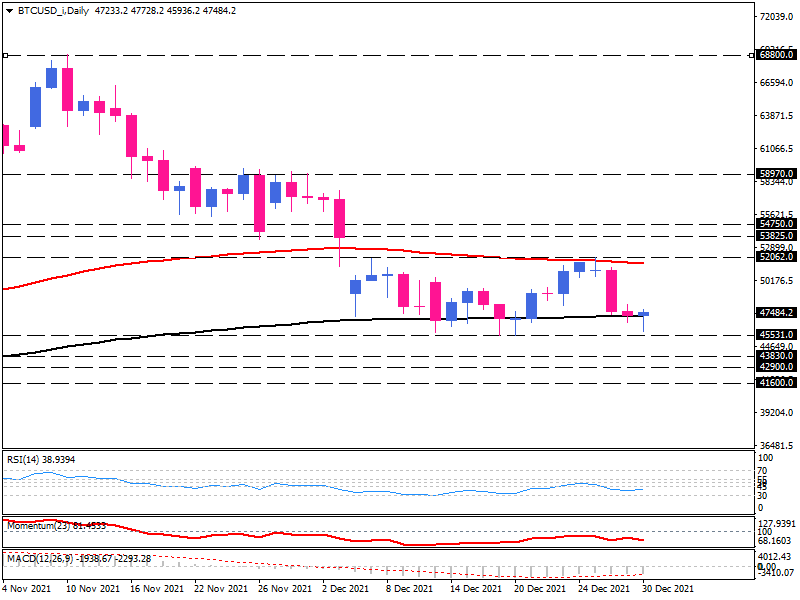
Bitcoin sellers step back on the edge of the range
2021 will be a memorable year of visibility for crypto assets. The value of BTC has more than doubled during this year from $28,803.59 on the 1st of January, 2021, to $68,789.63 on the 10th of November, 2021. The aggregate crypto capitalization also jumped on the back of the popularity of cryptocurrencies in the wake of rising inflation and risk appetite and surpassed $3 trillion this year with a rise of almost 70% in Bitcoin's price amidst overwhelming developments around financial markets rolled out by central banks and large institutional investors.
Technical view
After forming a bearish reversal from all-time highs, this popular cryptocurrency has been trading in a range since the 6th of December. BTC sellers are knocking the floor of 45531 dollars.
A bounce from the lower edge of the rectangle at this level would keep the cryptocurrency sideways with the hope of reaching the 52062 handle again. Where the 100-day exponential moving average holds a wall of resistance.
In order to find a clear direction, the range pattern should be penetrated from one side.

In case we see a sustained break below this support area at 45531 dollars, the 43830 barrier is expected to offer support. Increasing bearish momentum could result in hitting 42900 dollars, and overcoming this barrier would push the price lower towards 41600.
Otherwise, bulls must break above this hurdle at 52062 and pass the 100-day EMA to hold the trend up. In that case, the next obstacles might come from 53825 and 54750, respectively.
Short term oscillators convey bearish bias with the RSI reading below the 50-baseline and the momentum in selling territory. While the MACD bar is dipping in the selling region above its signal line.
Technical Analysis
Discover ideal profit opportunities for your everyday trading with the help of our in-depth technical insights comprised of facts, charts and trends.


