CAD/JPY comes under pressure after forming a reversal
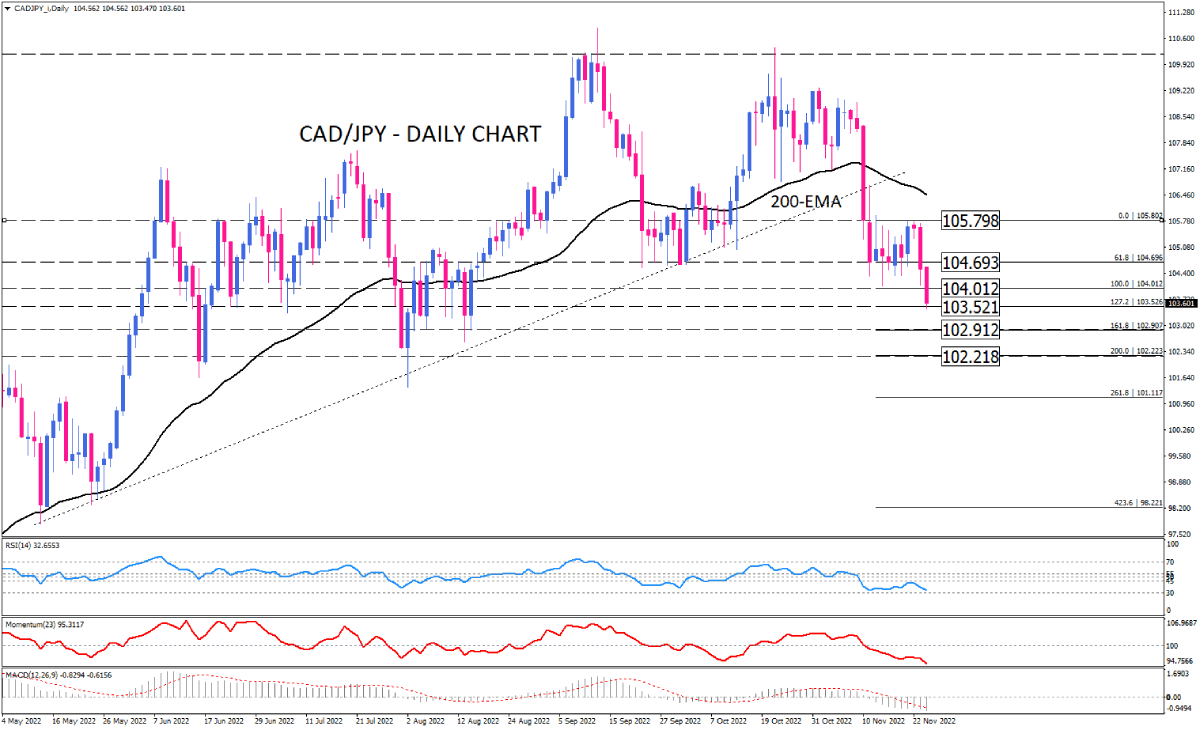
CAD/JPY was trading upward until sellers succeeded to break the trendline to the downside and push the price below the 200-EMA. The move followed the buyers’ retreatment from an eight-year high of around 110.175 in late October. It then resulted in the completion of a double-top reversal pattern by breaking the neckline at 104.693. in the aftermath of prevailing bearish bias, bears are driving the market lower towards the 103.521 hurdle. If they find sufficient momentum to overcome this barrier, the next target would be estimated at around 102.912 and 102.218, respectively, which were seen before in July and August.
Alternatively, in case of a bearish momentum losing steam, the buyers will attempt to pare some losses in an attempt to reach 105.798. However, even if this level gets broken, bulls still must face the 200-EMA wall of resistance to make their way to the upside.
Short-term momentum oscillators reflect a persisting bearish sentiment. RSI is headed towards the 30-level. likewise, momentum is extending its downward movement in the selling area. At the same time, MACD bars have crossed below the signal line adding to negative reading in the selling zone.

Technical Analysis
Discover ideal profit opportunities for your everyday trading with the help of our in-depth technical insights comprised of facts, charts and trends.


