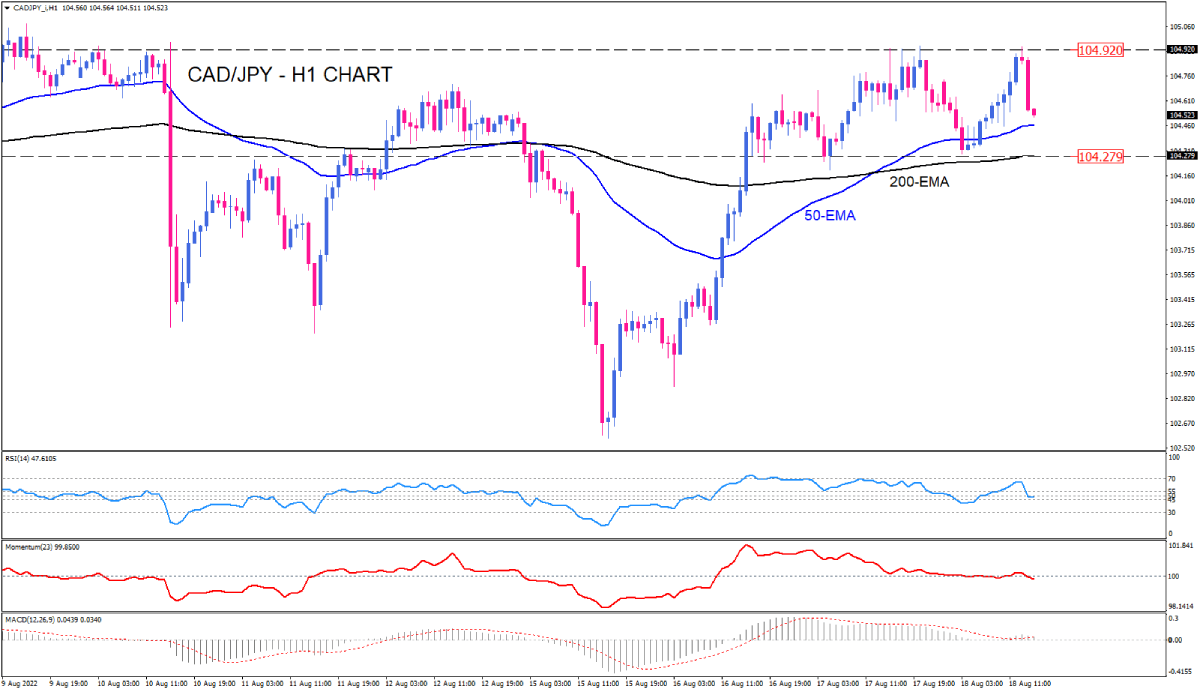
CAD/JPY sellers reject a beakout
As we can see on the hourly chart, CAD/JPY, which has been trading between 104.274 and 104.920 since mid-August, has faced selling pressure after hitting its range ceiling. Sellers are trying to push the price down toward the 50-period exponential moving average.
Furthermore, trend strength oscillators also indicate a reduction of upward momentum in the market, which occurred following the dominance of sellers. The RSI has reached the neutral zone border, descending from around 70, and momentum has retreated to the 100 mark and is pointing down. The MACD bars also fall to zero, indicating the weakening of the bullish bias.
With selling forces dominating, we may be looking at the next support being the 50 moving average. Suppose this dynamic support fails to prevent further declines. In that case, the bottom of the price range, around 104.279, is likely to be the next destination for sellers. This level is aligned with the 200 exponential moving average, considered a key support wall.
The following price direction will be determined when the current range is broken. If this currency pair increases its downward tendency and the price is pulled below the average of 200, the outlook will be bearish.
Otherwise, if buyers return to support the range, this currency pair will continue sideways towards the range's ceiling at 104.920.

Technical Analysis
Discover ideal profit opportunities for your everyday trading with the help of our in-depth technical insights comprised of facts, charts and trends.


