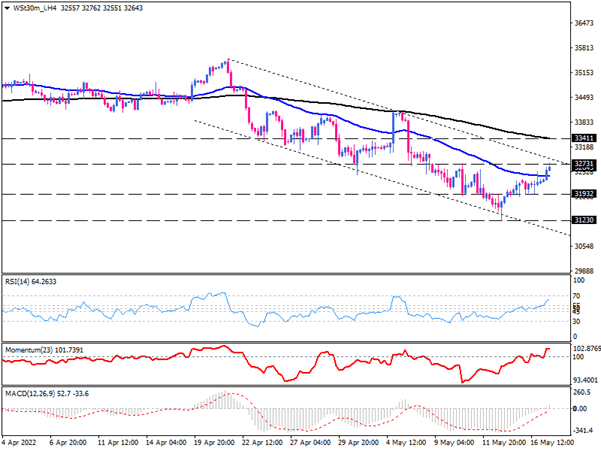
DOW JONES bulls heading the down trendline
As we can see on the four-hour chart, the index has been trading downside below the 50 and 200 EMAs within a descending channel since April 22. While the dynamic support of the channel capped further losses, encouraging buyers to step in and push prices higher. Currently, the index is trading around the 32731 mark. We see they passed the 50-EMA, heading towards the upper edge of the channel.
It is mainly expected the downtrend will continue, and this falling trend line holds resistance. On the downside, if sellers make a cue from the falling trend line, the price movement can reverse on the back foot. Especially when we see RSI is rising sharply towards the overbought area. If that is the case, selling forces may press the index to push down towards the immediate support around the 31932 mark. If this hurdle fails to limit bearish bias, the two-month low at 31230 can prove to be the next target for sellers.
Otherwise, even if bulls manage to violate the channel line, the 200-EMA will be standing in their way as the following resistance. A decisive break above the 200-EMA will represent buyers' dominance, signalling a probable bullish reversal.
Momentum oscillators reflex the current bullish bias in the short term. RSI is on its way to conquering the 70-level soon, which may cause buyers to take a breather around the down trendline. Momentum is trending upward above the 100-threshold in buying area. Likewise, MACD bars have crossed above the zero-line, followed by the rising signal line.

Technical Analysis
Discover ideal profit opportunities for your everyday trading with the help of our in-depth technical insights comprised of facts, charts and trends.


