EUR/JPY selling pressure is intensifying
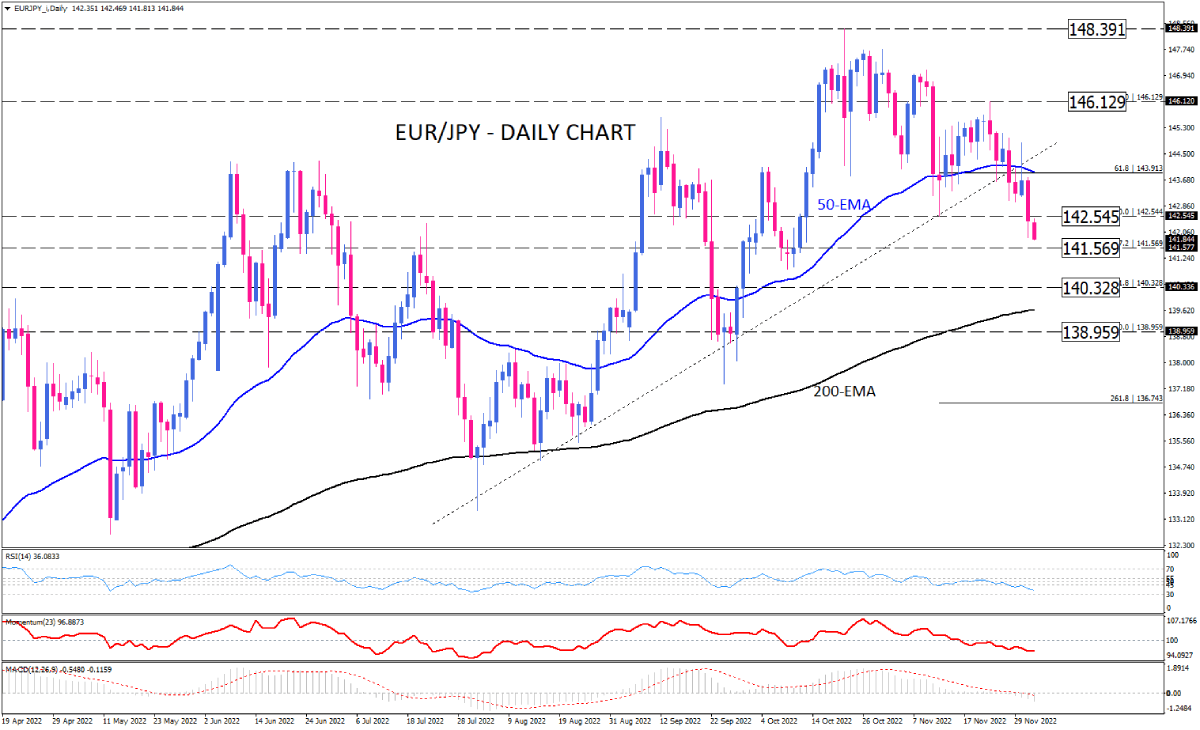
EUR/JPY has been suffering from prevailing selling pressure in recent weeks. As soon as sellers spotted the end of the uptrend that started in March, they also pushed the price below the 50-EMA on the daily chart. A decisive break below the 142.545 hurdle convinced many traders that the bearish sentiment would last longer. This resulted in the formation of a head and shoulders pattern bolstering euro sellers' odds. The neckline can be drawn by connecting the lows on September 23 and November 11. Thus, as long as they manage to keep the price below this key level the setup is considered bearish.
Meantime, if selling forces keep strengthening the next target would emerge at 141.569. A further decline below this barricade could bring 140.328 into bears’ sight. If that happens, the first H&S projection will be captured at the half distance between the head and the neckline.
Otherwise, euro buyers are unlikely to be able to turn back into the game until the price has recouped all these two days' losses by getting back over the 142.454 level of interest. However, even in such a case, only a breach of the right shoulder at 146.129 will invalidate the H&S pattern.
Short-term momentum oscillators imply a bearish picture. RSI is trending downward in the selling area, heading towards the oversold boundary at 30. Momentum, also, is dipping in the selling zone, below the 100-threshold. At the same time, both MACD bars and the signal line have crossed the zero line to the downside, triggering a bearish signal.

Technical Analysis
Discover ideal profit opportunities for your everyday trading with the help of our in-depth technical insights comprised of facts, charts and trends.


