GBP/AUD awaits directional momentum after halted downtrend
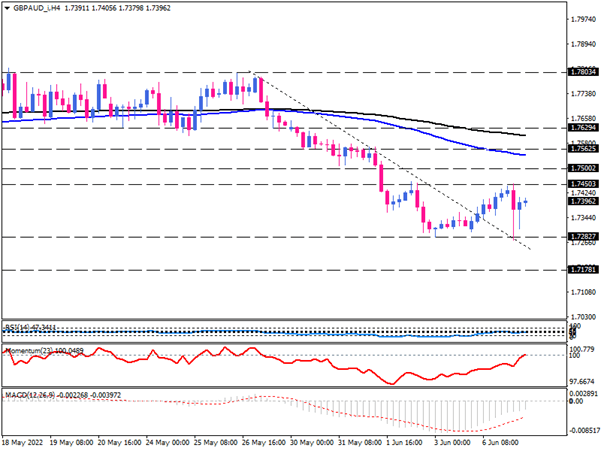
On the four-hour chart, GBP/AUD is trading in a range between 1.74500 and 1.72827 after falling sharply from its almost three-month high and breaking its downtrend line. Sellers failed to overcome the last price floor around 1.72827 and continue the downtrend. The price pulled back from the broken trendline, which became dynamic support.
If sellers want to continue the downtrend, they should get enough power to lower the price to the 1.72827 support level. If the momentary downtrend breaks this key support, the downtrend could continue to the next support area around 1.71781.
Otherwise, with the return of buyers, their target will be the range resistance at 1.74500. A sustained move above this level will confirm the formation of a double-top pattern and will encourage more buyers to buy GBP/AUD, which can push the price higher towards the next target around the 1.75 mark. Breaking this hurdle with the persisting bullish momentum will pave the way to meeting the 100-period exponential moving average, which coincides with the 1.75625 handle. Further traction may put the 1.76294 barrier in the spotlight.
Short-term momentum oscillators indicate the relative balance of buying and selling forces. The RSI is in the neutral area and has no directional signal. The momentum is moving close to the 100-threshold. The negative MACD bars are also shrinking towards zero above the signal line.

Technical Analysis
Discover ideal profit opportunities for your everyday trading with the help of our in-depth technical insights comprised of facts, charts and trends.


