GBP/CAD extends losses after a range breakout
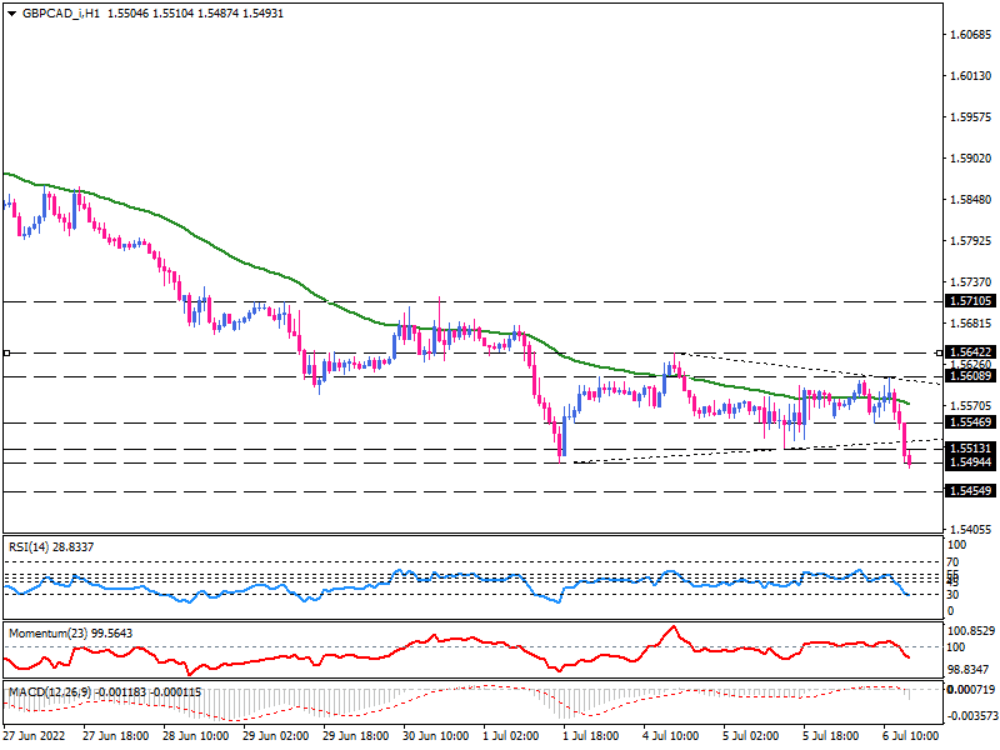
On the one-hour chart, there is a persistent undertone of weakness and vulnerability in GBP/CAD, with the cross trading below the triangle support line. The pair has extended its losses below Tuesday's low at 1.55131, with sellers having a shot at the nine-year low after they failed to break below 1.54944 twice in mid-June and the first of July.
A sustained move below this barrier will keep sellers hopeful of dragging the price down towards the 1.54549 mark. However, RSI hints the market is getting oversold during a sharp sell-off in the Wednesday trading session, which can have the bears taking a breather and maybe retest the broken triangle's support line before entirely dominating the market. GBP's recovery will be limited, and the outlook for further losses could lead to a low of around 1.52388, as seen in 2013.
Otherwise, bulls need to pull back GBP/CAD towards the 1.56089 previous level of interest to keep the range in place. If buyers wish to turn the trend bullish, they must break above the triangle's dynamic resistance, coinciding with the last market top around 1.56089.
At this point, we have bearish weekly price signals and bearish short, medium, and long-term trend momentum signals against the sterling. Momentum is trending downward below the 100-threshold. MACD bars run in the selling area, with the signal line expected to cross the zero line soon.

Technical Analysis
Discover ideal profit opportunities for your everyday trading with the help of our in-depth technical insights comprised of facts, charts and trends.


