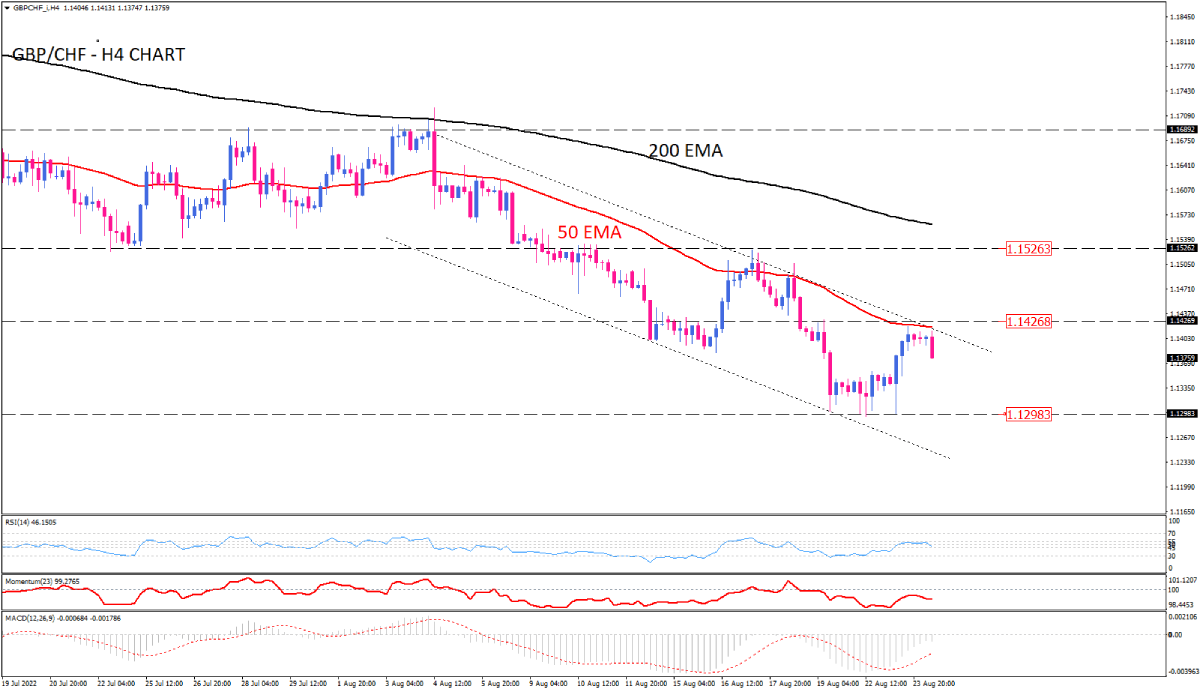
GBP/CHF sellers attempt to hold descending channel
GBP/CHF on the four-hour chart is in a downtrend, and the 50-EMA has held resistance since early August. Connecting major tops and bottoms results in a descending channel. After the downtrend delayed at the lower edge of the channel around 1.12983, the price made a new lower top with the 50-EMA stalling the correction on the verge of the upper channel line, which is in line with 1.14269. Suppose sellers take a cue from this confluence of resistance. In that case, the further decline within the channel is expected to keep the downtrend intact. Should that be the case, the previous market bottom at 1.12983 stands as the following support.
Otherwise, if the price surpasses the 1.14269 hurdle, crossing above the 50-EMA, an upside breakout can encourage more buyers to reconquer the two-week top at 1.15262, lining up with 200-EMA.
However, short-term momentum oscillators suggest buying pressure is waning and sellers attempt to regain control. RSI is pointing down after hitting the ceiling of the neutral zone, which reflects a balance in the session. However, momentum reveals intensifying bearish bias as it oscillates in the selling area below the 100-threshold. While MACD bars shrink beneath zero, hinting at a lack of persistent momentum in either direction.

Technical Analysis
Discover ideal profit opportunities for your everyday trading with the help of our in-depth technical insights comprised of facts, charts and trends.


