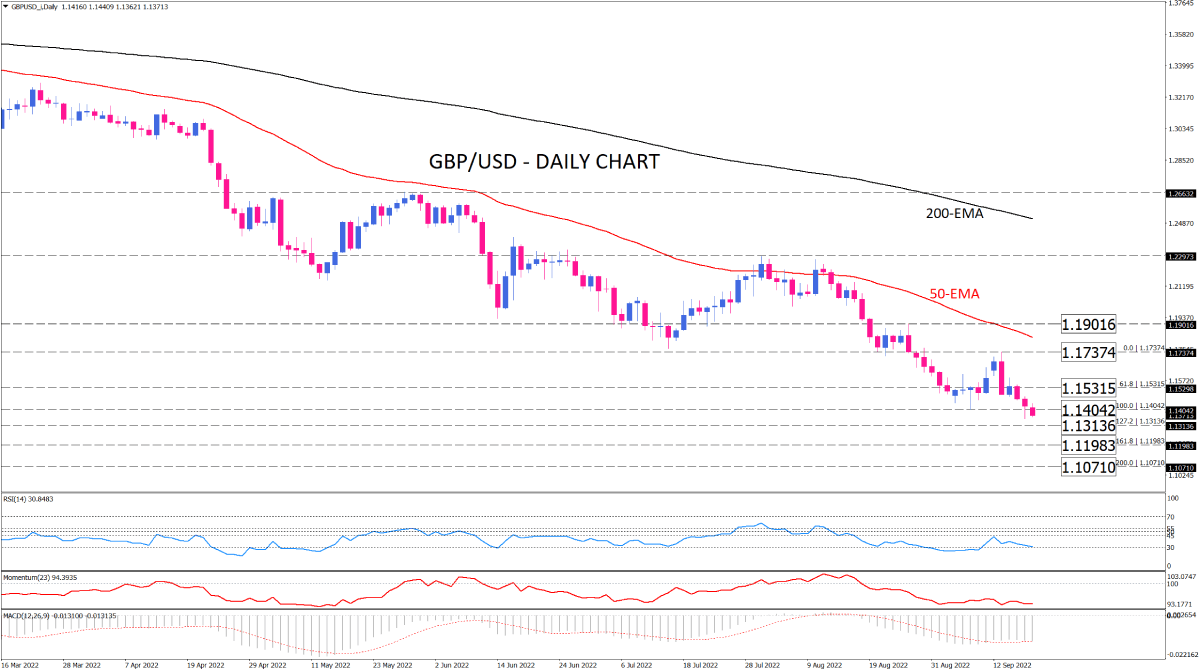
GBP/USD sellers retain the downtrend
GBP/USD is trending downward on the daily chart, below both the 50 and 200-day exponential moving averages. With sellers breaking the crucial support level of 1.14042, the downtrend gained momentum on Monday, turning the focus to 1.13136. If bearish sentiment continues growing, the pair may pass this hurdle. That will put more pressure on the pound to fall toward the 1.11983 barrier for the first time in more than four decades. Intensifying bearish momentum may result in breaking this barricade. If that’s the case, the pair can extend its declines to lay down at 1.10710.
Otherwise, Should buyers defend the 1.13136 mark, the price can pull back to retest the 1.15315 previous level of interest. Further traction will bring the last top at 1.17374 to buyers’ attention. A decisive breach above the last top can put the pair on track to reverse the trend.
Short-term momentum oscillators reflect a prevailing bearish bias since the price bounced back from the 50-EMA in early August. RSI is floating around the 30-level, suggesting sellers may get exhausted soon. Momentum is hanging out around its lowest level in the selling region. MACD histogram implies a divergence between slow and fast-moving averages to the downside as MACD bars get taller in the negative region.

Technical Analysis
Discover ideal profit opportunities for your everyday trading with the help of our in-depth technical insights comprised of facts, charts and trends.


