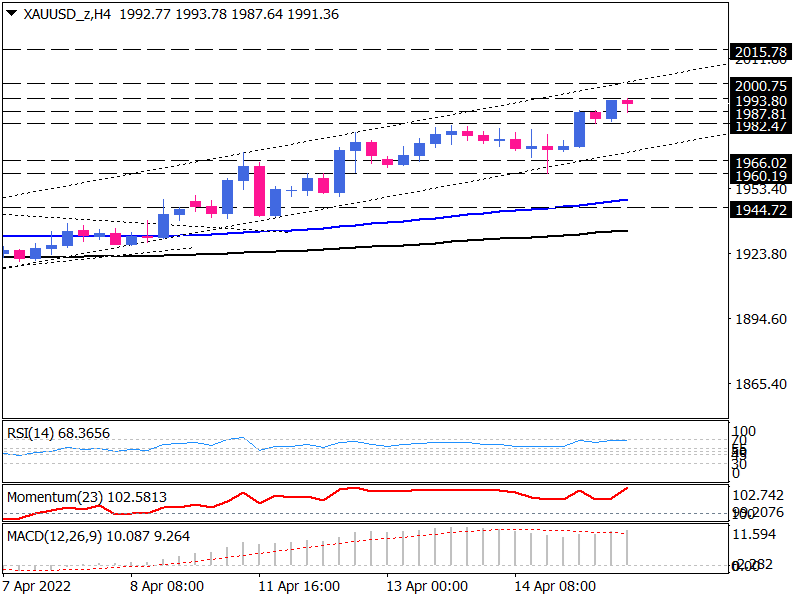
Gold is climbing in an ascending channel
Gold shows signs of ticking up on the 4-hour chart within an ascending channel that has been established after a break above a symmetrical triangle pattern. Having taken out the 1981 barrier in early trading on Monday, gold has found fresh buyers on the first day of the week and shot up to a new multi-week high.
Presently, this precious metal is nearing the 1994 barrier. In the event that buyers are able to maintain positive momentum, they could overcome this obstacle and reach the psychological mark of 2000 dollars. Breaking this barrier can propel prices towards 2015 dollars as the next resistance.
As a result, a dip in the price could drive it towards the 1981 level if sellers take their cue from the narrowing momentum oscillators. In the case of further declines from this level, it could lead to a test of the channel support around the 1966-1970 support zone. There is, however, a bullish bias supported by the 100 and 200 exponential moving averages, which are scaling up.
Furthermore, momentum oscillators add to the upside filters. RSI shows the buyers are edging towards overbought territory at the 70 level. In the buying region, momentum is moving sharply higher to surpass previous peaks. The MACD histogram moves in a positive direction to advance above the signal line as well.

Technical Analysis
Discover ideal profit opportunities for your everyday trading with the help of our in-depth technical insights comprised of facts, charts and trends.


