Gold sellers face a crucial support level
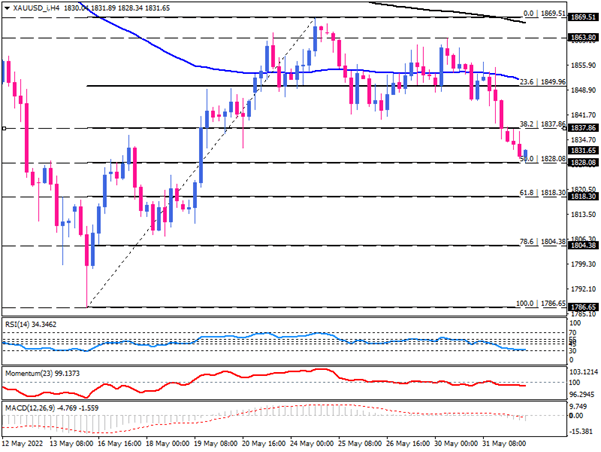
On Wednesday, gold is trading in a bearish manner on the four-hour chart, as falling below the 100-EMA has prompted more sellers to take control of the market. Additionally, the price action suggests the formation of a double-top pattern following the failure of buyers to reclaim last week's high at 1869.51.
The recent decline has seen prices fall to 1828.08, which coincides with a 50% retracement of the prior upward movement from 1786.65 to 1869.51. To extend the downtrend, sellers need to make a persistent move below this hurdle. If that is the case, the immediate support can be found at the 61.8% retracement mark located at 1818.30. Breaking below this level reflects a growing negative sentiment with sellers eyeing 1804.38 as a target.
Alternatively, if buyers get back into their seats, the fall may be halted around the key 1828.08 support level. Upon an increase in bullish momentum, gold can return to the level of interest at which it was in 1837.86.
Momentum oscillators imply a bearish bias for the short term. RSI is moving downward in the selling area, but with a reading near 30, there is not much room for sellers before oversold territory is reached. A near-30-RSI-reading in conjunction with the price near the key support increases the likelihood of a pause in the downtrend. While momentum is moving down below the 100-threshold. MACD bars are also growing in the selling zone below the signal line, reflecting the dominance of sellers.

Technical Analysis
Discover ideal profit opportunities for your everyday trading with the help of our in-depth technical insights comprised of facts, charts and trends.


