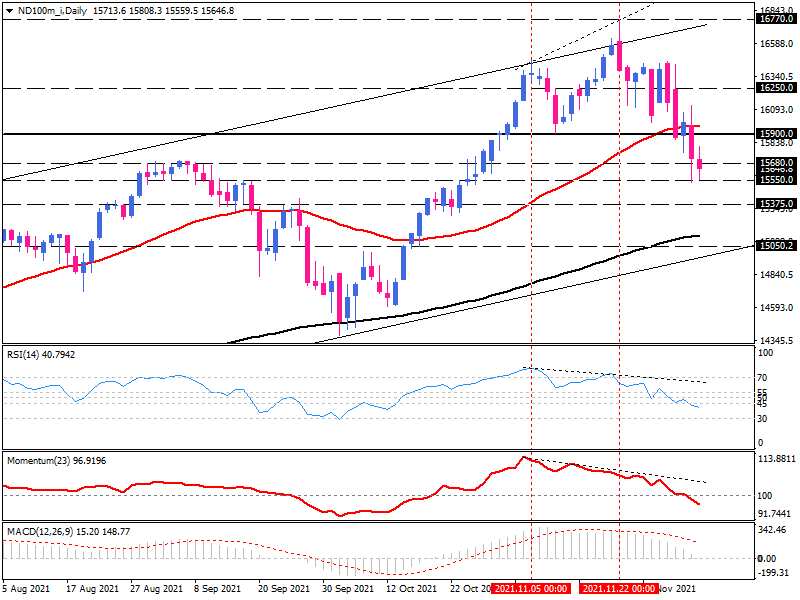
Nasdaq is set to test a lower support
Following last week's sell-off, the NASDAQ-100 futures index holds at a one-month low as investors are still reassessing the new Omicron Covid strain risks.
Last week, Wall Street was wobbly as investors rushed for bargains every time the market went down. However, all three US indices have declined sharply this week, with the Nasdaq 100 futures on pace for its third consecutive weekly loss.
The index has recently dived, but despite recent dips, it has remained on a solid long-term uptrend since March 2020. As such, some investors seek to buy the dip and take advantage of the low prices.
Nasdaq slides below the one-month low
After reaching the upper line of the ascending channel at all-time highs near 16770, the price has fallen sharply to the one-month low underneath the 15680 crucial barrier, and below the 50-day EMA support area. As the positive momentum waned, a continued decline below this level has implied a bearish reversal.
The decisive breach of the 50-day EMA has paved the way for a down move towards the lower boundary of the ascending channel. Before reaching there, the immediate support area is found around September's high at the 15550-mark. In the event of further fall, the market would drop to the 15375-barricade. Penetration of this support could push the index into the vicinity of the 200-day EMA and the channel's lower boundary located around the 15050-mark.
It appears that the upward movement has run its course, as both RSI and momentum have posted bearish divergences by forming lower highs. Moreover, the RSI has kicked in below its neutral territory, reflecting the gaining selling bias, while the MACD is about turning below the zero line, deviating from its signal line.
Alternatively, if buyers hold above the 15900 barriers, they may aim to break the initial resistance level at 16250. Overcoming this handle would send the price towards the 16770 mark around November's highs.

Technical Analysis
Discover ideal profit opportunities for your everyday trading with the help of our in-depth technical insights comprised of facts, charts and trends.


