NASDAQ100 retains bearish outlook
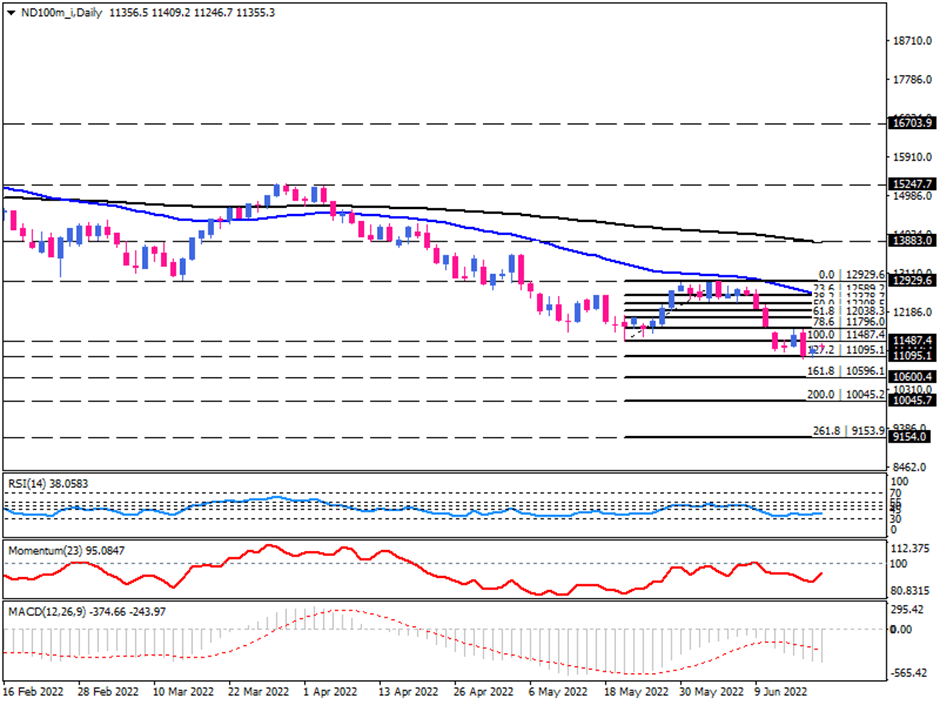
On Monday, the more aggressive line by central banks adds to headwinds for economic growth and equities. As well as other major indices, the NASDAQ100 futures index has been trading downward at its lowest level since November 2020. Following a rebound from the 50-day exponential moving average, sellers continue to dominate the market by breaking below May’s lows at the 11487.4 mark. Despite the market witnessing a slight recovery last Friday, the bearish outlook remains as long the index holds below the 50 and 200-day EMAs.
If the selling pressure persists, the price may fall to challenge the recent low of 11049, which corresponds to the 127.2% Fibonacci extension of the last upward swing. By violating this zone, the 10596.1 hurdle, the 161.8% Fibonacci extension, may prove a formidable obstacle for the bears. Unless the price can halt there, the 10045.2 support region might be the next floor to concern.
Alternatively, if buyers were to regain the ground above the 11487.4 barrier, they would be able to claim the 50-day EMA in the confluence of the previous top of 12929.6. Any traction above the resistance zone may help pave the way for the 200-day EMA located around the 13883 resistance area.
Descending moving averages exhibit the dominance of sellers in the market. Likewise, short-term momentum oscillators convey a bearish bias. RSI is hovering in the selling region. Momentum is pointing upward but still remains below the 100-threshold. MACD bars are falling further in the negative area below the signal line.

Technical Analysis
Discover ideal profit opportunities for your everyday trading with the help of our in-depth technical insights comprised of facts, charts and trends.


