Ripple sellers dominate the market
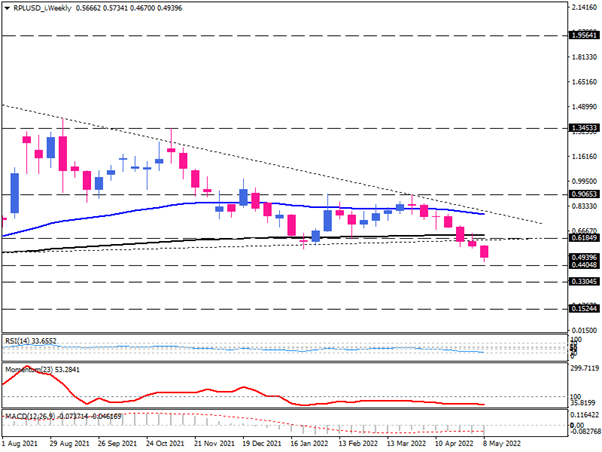
Ripple on the weekly chart is signalling a significant bearish bias as RPLUSD continues to trade below its 200-week exponential moving average. Following a massive fluctuation in 2021 from April to June, this solid support had limited losses twice. However, finally, sellers found enough strength to break below this level two weeks ago, pushing prices down for the seventh consecutive week.
Ripple is currently trading at the 26-month low, with bears aiming for the 161.8% Fibonacci extension at 0.44048. if this level can’t offer sufficient support to the price, a sustained move below this hurdle may put the 0.33045 barrier in the spotlight. Having this level broken, a prevailing bearish momentum would trigger a further decline towards the 0.15244 barricade.
Otherwise, according to momentum oscillators, sellers may take a breather around the 0.44048 level of interest as the relative strength index is approaching the oversold area sharply. That would be a chance for buyers to cut their losses by attempting to retest the 200-week EMA around the 0.61849 barrier.
Momentum also implies slowing negative momentum as it has been flattening below the 100-baseline for five months. While MACD histogram is extending in negative territory below the signal line.

Technical Analysis
Discover ideal profit opportunities for your everyday trading with the help of our in-depth technical insights comprised of facts, charts and trends.


