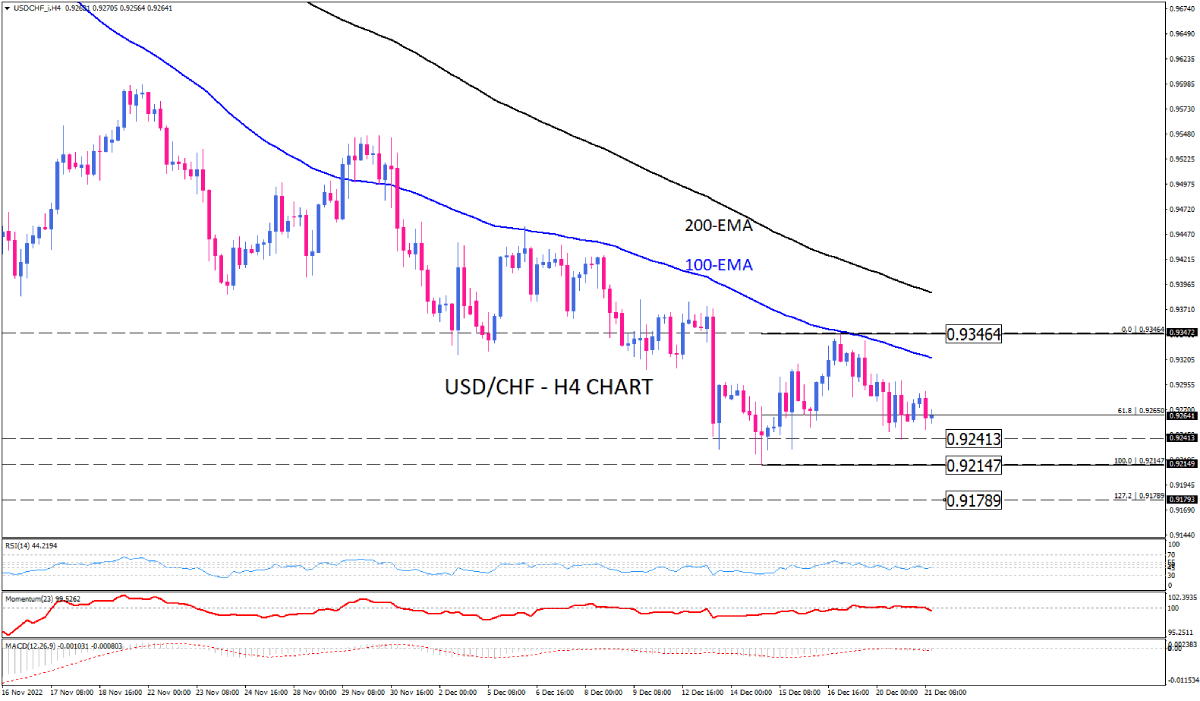
USD/CHF sellers await a clear directional signal
As seen on the four-hour chart, USD/CHF has been trading in a downtrend since early November, below both the 100 and 200-exponential moving averages. However, the recent decline has lost its steam, resulting in a consolidation around the 0.92650 mark. If sellers take the lead, the price can fall to 0.92413. A further decline below this barrier would send the pair towards 0.92147. having this obstacle overcome, 0.91789 could prove to be the next support, which is the lowest level seen since March.
Otherwise, should buyers defend the 0.92413, the range can be extended for some time towards the 100-EMA. Even though further traction through this barrier occurs, 0.93464 seems to be a solid resistance on the way up.
Short-term momentum oscillators reflect emerging bearish bias. RSI has just pulled down of the neutral zone. Momentum is crawling down for a sustained move below its 100-threshold. Negative MACD bars are dipping further in the selling area.

Technical Analysis
Discover ideal profit opportunities for your everyday trading with the help of our in-depth technical insights comprised of facts, charts and trends.


