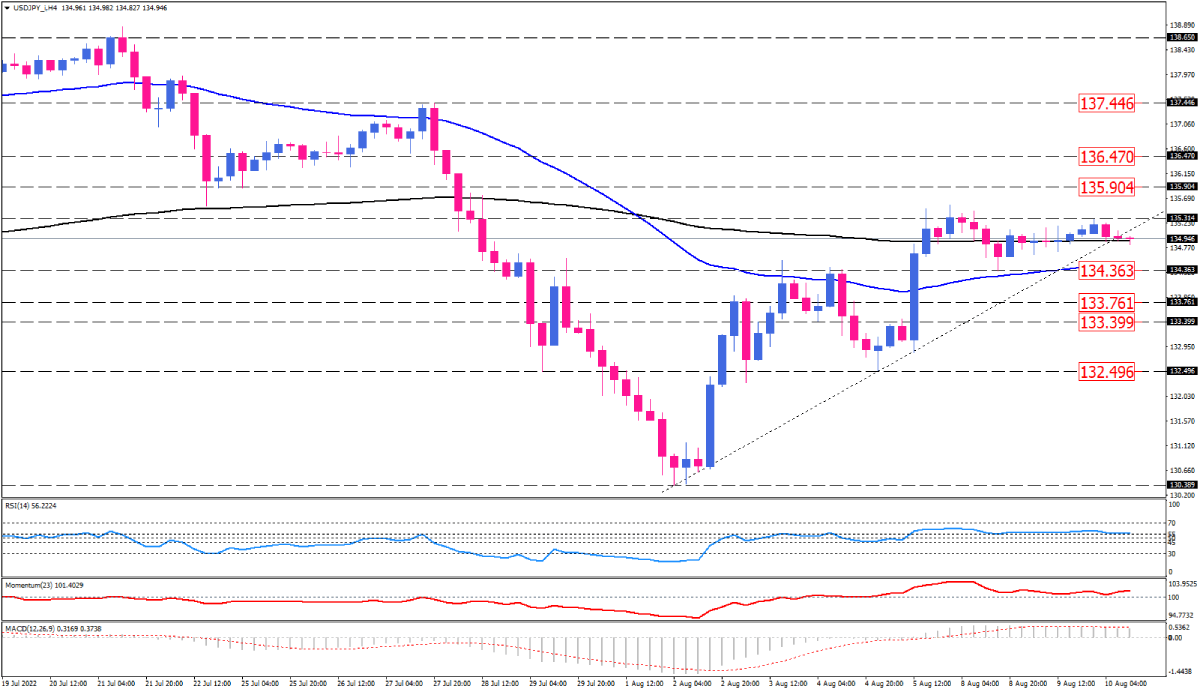
USD/JPY rally gets out of steam ahead of US CPI
The USD/JPY rally has lost momentum ahead of US inflation figures on Wednesday. USD/JPY on the four-hour chart is consolidating back and forth of the flattening 200-period exponential moving average as prices formed a lower top at 135.314. currently, the pair sticks in a range between 135.314 and 134.363, while sellers are attempting to break the uptrend line and push the price lower back to the range’s support, which is in line with the 50-period EMA.
If CPI numbers come lower than expected, the USD/JPY selling pressure can intensify. In that case, bears can overcome the 50-EMA and send the prices for a free fall towards 133.761 and 133.399. A decisive break of these obstacles will lead to a further decline to the previous market bottom, seen on August 5, around 132.496.
If CPI numbers come higher than expected, the USD will get stronger, and USD/JPY may reach its range resistance at 135.314. Prevailing bullish sentiment can result in a break above this hurdle, with buyers claiming the 135.904. If the rally continues, the next resistance will appear at 136.470 before getting to the 137.446 barrier.
Short-term momentum oscillators imply a fading bullish bias. RSI is struggling with the neutral boundary to remain in buying area. Momentum, however, is taking off from the 100-threshold, and MACD bars are shrinking toward the zero-line, below the signal line.

Technical Analysis
Discover ideal profit opportunities for your everyday trading with the help of our in-depth technical insights comprised of facts, charts and trends.


