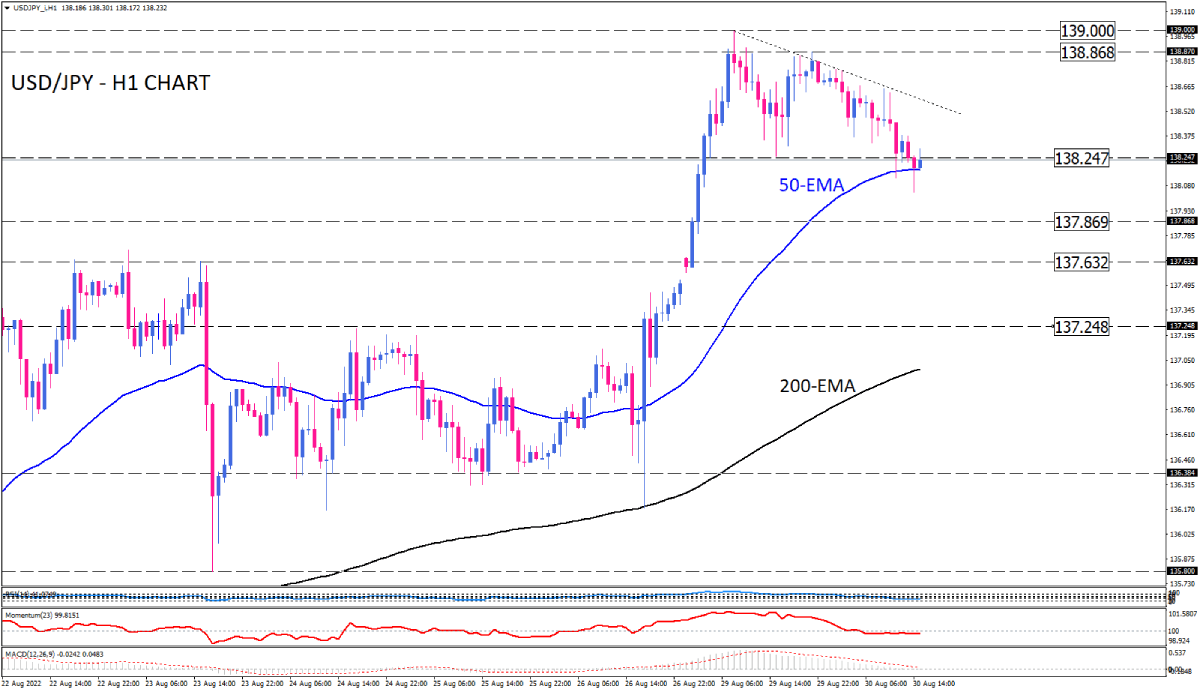
USD/JPY sellers pause the rally
As seen on the one-hour chart, after peaking at 139.00, the USD/JPY rally lost momentum with sellers in charge, forming a descending triangle pattern. Tuesday trading has brought more selling forces into the play as the pair is challenging with a crucial support level at 138.247, which is in line with the 50-EMA.
If sellers succeed in overcoming this barrier, the price may settle around the 138.082 level. Further downward movement below this barricade can pave the way toward 137.867. A break of this hurdle will send the USD lower against the yen. In that case, the next support can confront the sellers around the 137.632 previous level of interest.
Otherwise, if buyers regain control of the market, an upward move can be extended around the triangle's upper boundary. Further traction can push prices higher to retrieve the 138.868 previous market top.
Short-term momentum oscillators imply bearish bias. RSI is trending downward in the selling area, and momentum is crawling below the 100-threshold. MACD histogram has crossed below the zero line.

Technical Analysis
Discover ideal profit opportunities for your everyday trading with the help of our in-depth technical insights comprised of facts, charts and trends.


