USD/JPY uptrend remains intact despite fading momentum
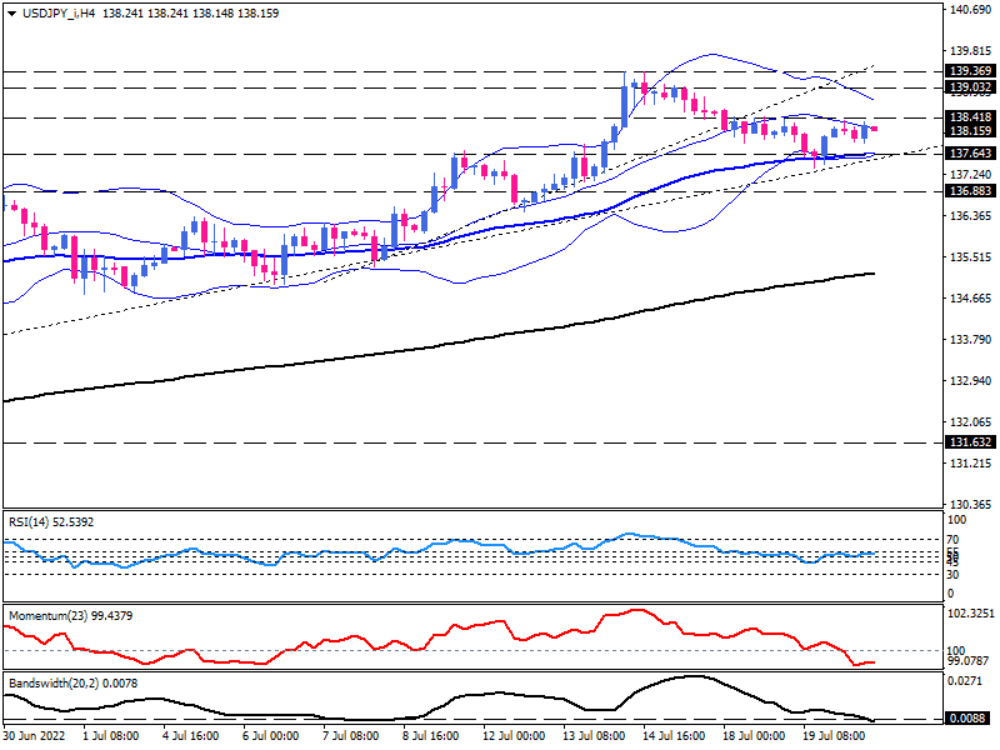
A four-hour chart of the USD/JPY is currently hanging around the upward trend line after the uptrend lost steam in the wake of the dollar's drop ahead of the BoJ meeting.
According to the current market condition, the pair is trading within a range between 138.418 ceiling and 137.643 floor. Short-term oscillators indicate that upward momentum has waned, even though the uptrend line has held up as support, indicating that the uptrend is intact. The RSI reading has fallen into the neutral zone after having reached the extreme buying level earlier this month. There is a decline in momentum below the 100-threshold, which indicates the upside forces are fading. In addition, Bollinger bands are converging with the upper and middle bands sloping downwards towards the lower band, which is flattening.
As long as the USD does not find enough buyers, the pair will descend toward the trendline, which is at the confluence of the 20-period SMA and the 137.643 range support. As selling pressures intensify, it may clear this hurdle and penetrate the trendline, which can be taken as a bearish reversal signal in the short term. A sustained move below this level will put sellers on their toes to target the 136.883 mark.
In any case, if the Bank of Japan announces further easing policies at its Thursday meeting, this will push the yen lower and send the USD/JPY higher. Assuming they succeed in overcoming the 138.418 resistance, the next resistance will come from 139.032.

Technical Analysis
Discover ideal profit opportunities for your everyday trading with the help of our in-depth technical insights comprised of facts, charts and trends.


